Who is here?
Species identification, traits, and organism descriptions.
THE KICS-ZERT RESEARCH DEMONSTRATOR
A leaf within a meadow. A filament within a network. A community within a reef. We bring fine ecological structure into view with AI.
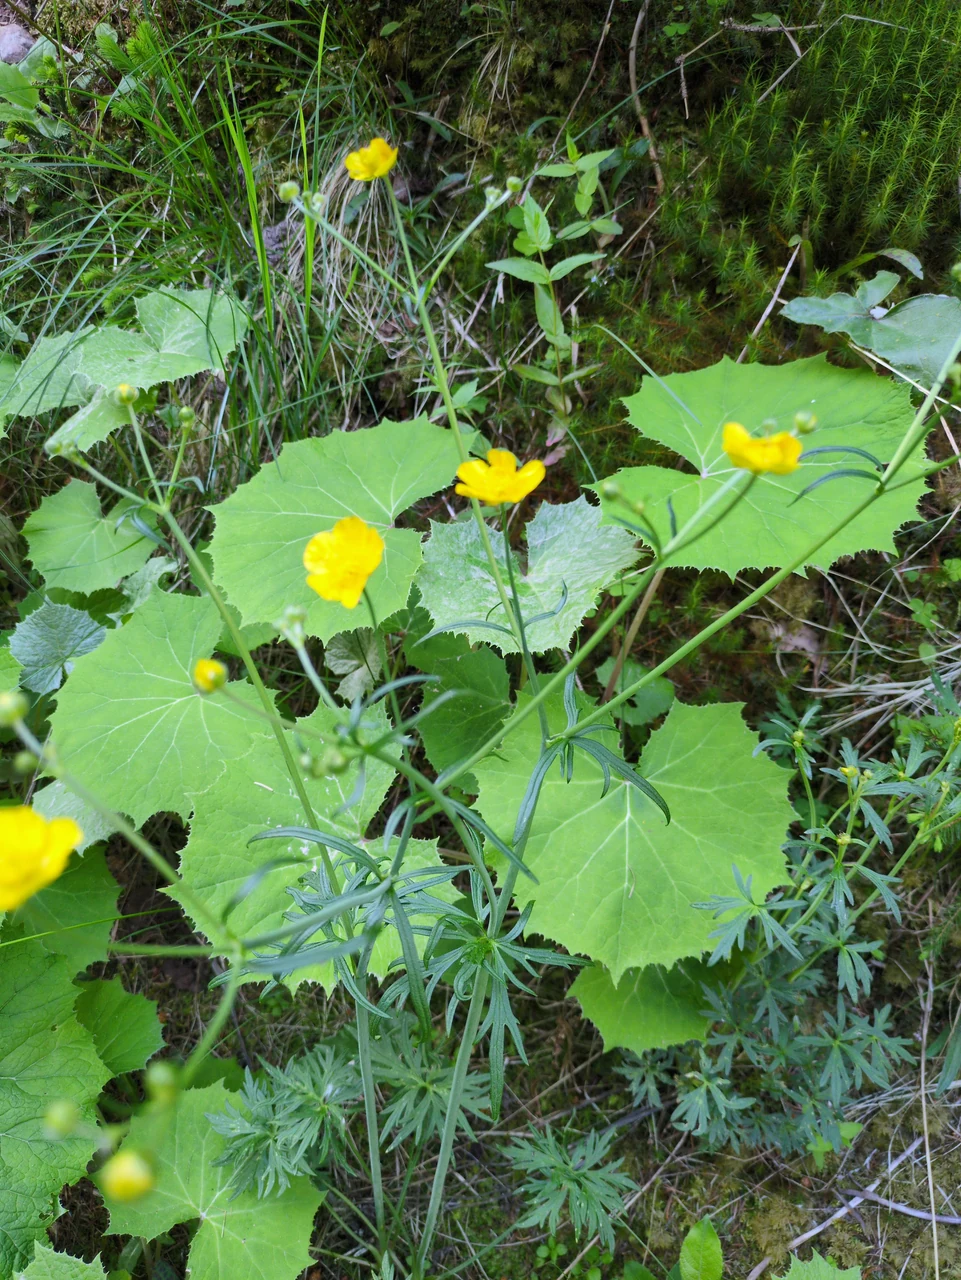
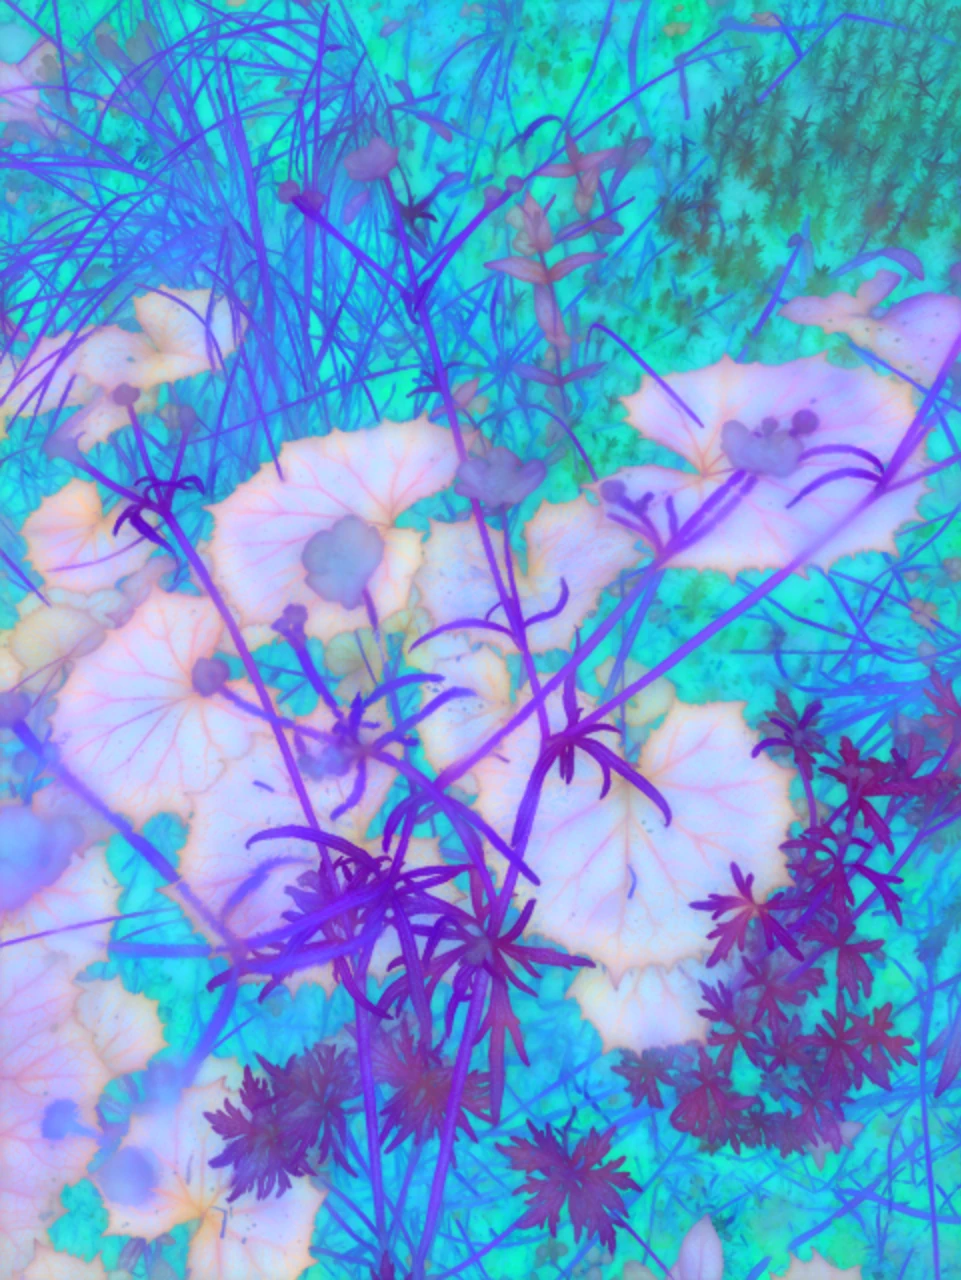 RGBour technology - 5%
Five ecological worlds to exploreSelect an example ↓
DINOv3 takes in the scene in a single pass. Our forced focused attention approach directs the same encoder to enlarged, overlapping local crops. See what changes in the visible structure.
Inspect the full analysisEXAMPLE 01 / 05
Photo 1781861008867
This vegetation example uses shared centered PCA with 16 retained axes, displaying the first three axes with the same color limits in both methods. FFA uses 5% crops. The full photograph is retained; colors are appearance features, not species labels.
Dense ecological scenes ask us to look beyond the whole image. We examine small, overlapping regions, enlarge them for the vision model, and average aligned views. The result is a detailed feature map that can be explored through color and clustering.
How the technology works5% and 10% crop scales bring fine structures into view.
Four-flip averaging and 75% overlap combine neighboring observations.
PCA and PCA–varimax color views; automatic K-means and GMM clustering, with λ=4.
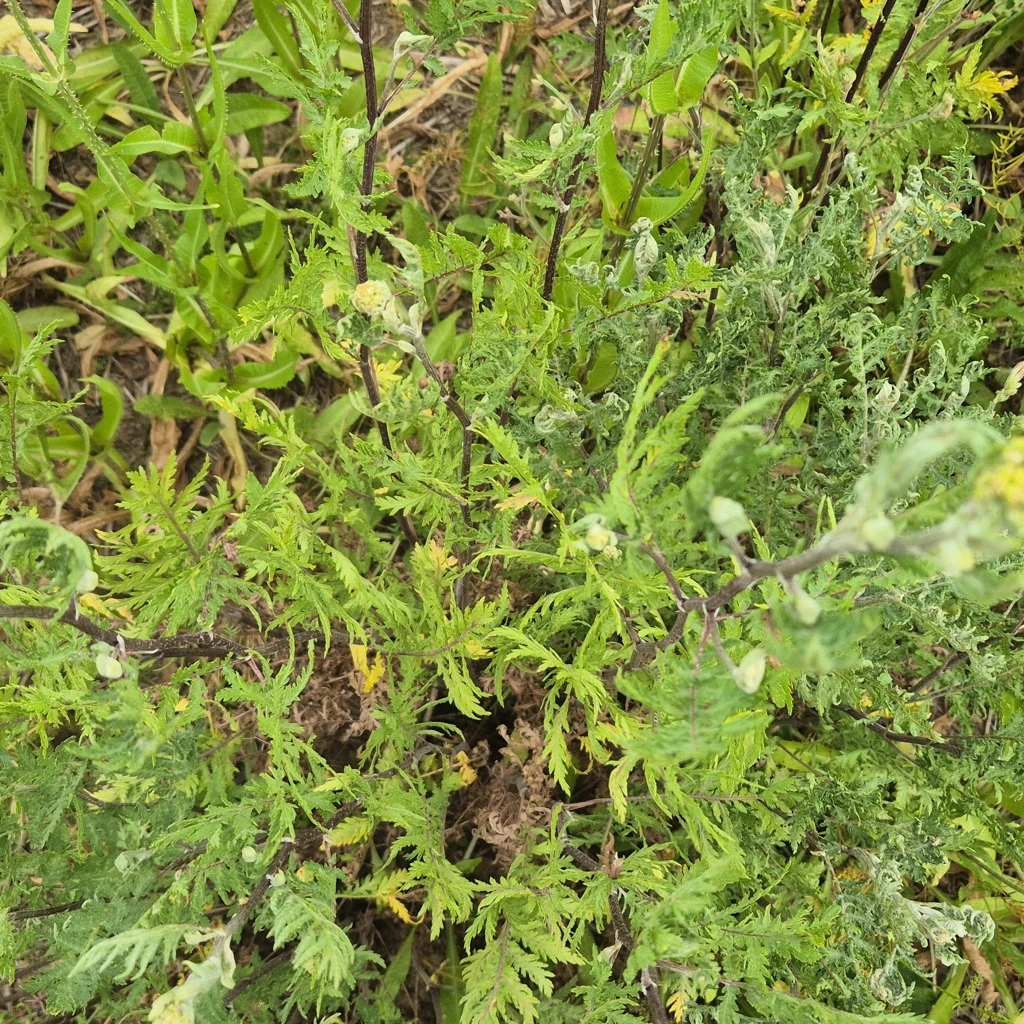
Bicubic interpolation
DINOv3 · 24 × 24 patch tokens
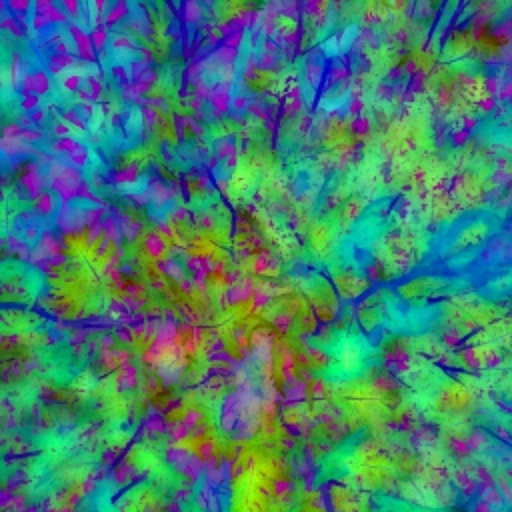
Go beyond the highlight images. Inspect the observations, compare methods, and follow the analysis into its details.
FIELD CASE STUDYMOIN 2025 · FOUR SITES
Four sites: Feßbach, Heidesheim, Rettmer, and Ribbeck.
Open the MOIN report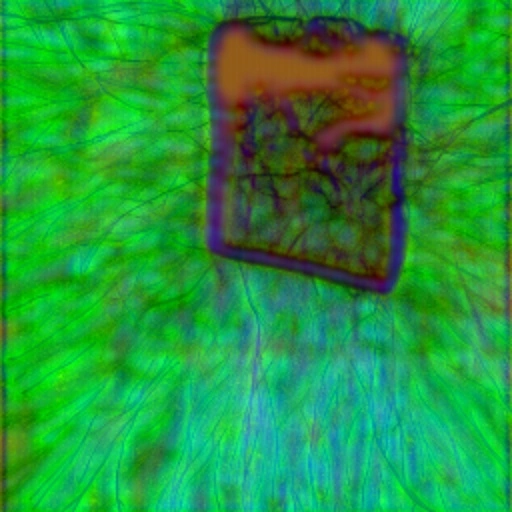 METHODS & VISUAL COMPARISONS
FIVE DATASETS · 50 IMAGES
Vegetation, fungal hyphae, UAV / aerial imagery, Coralscapes, and aquatic microscopy.
Open the five-dataset analysisTHE BIODIVERSITY MONITOR
Open the working application to sign in, submit photographs, and review analysis results.
TEN MATCHED EXAMPLES
SAM3, DINOv3, and forced focused attention on the same ecological photographs.
Compare the technologies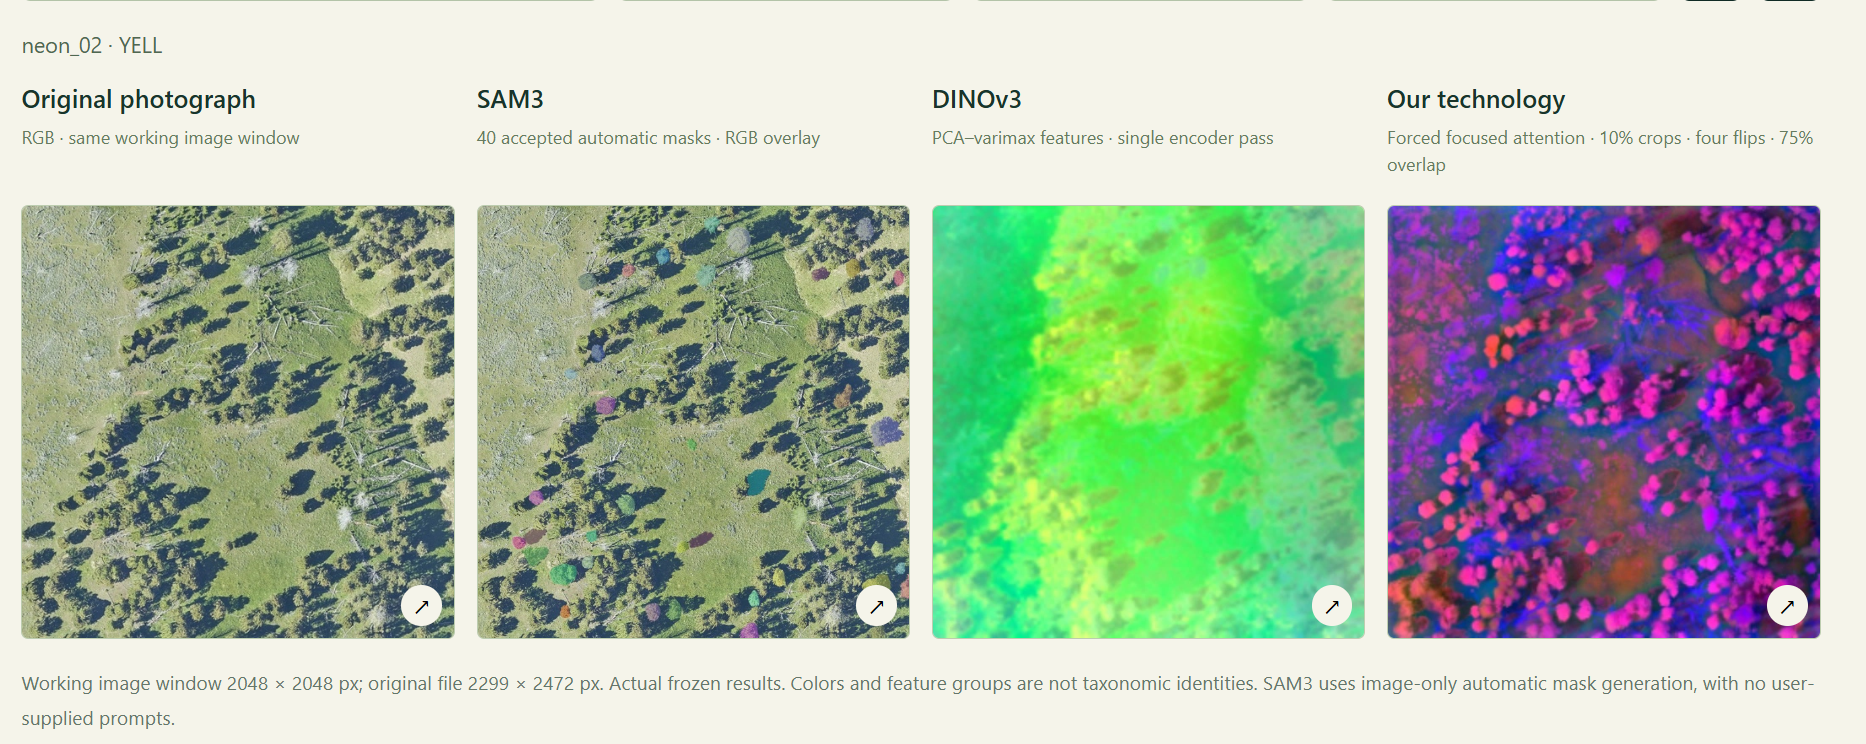
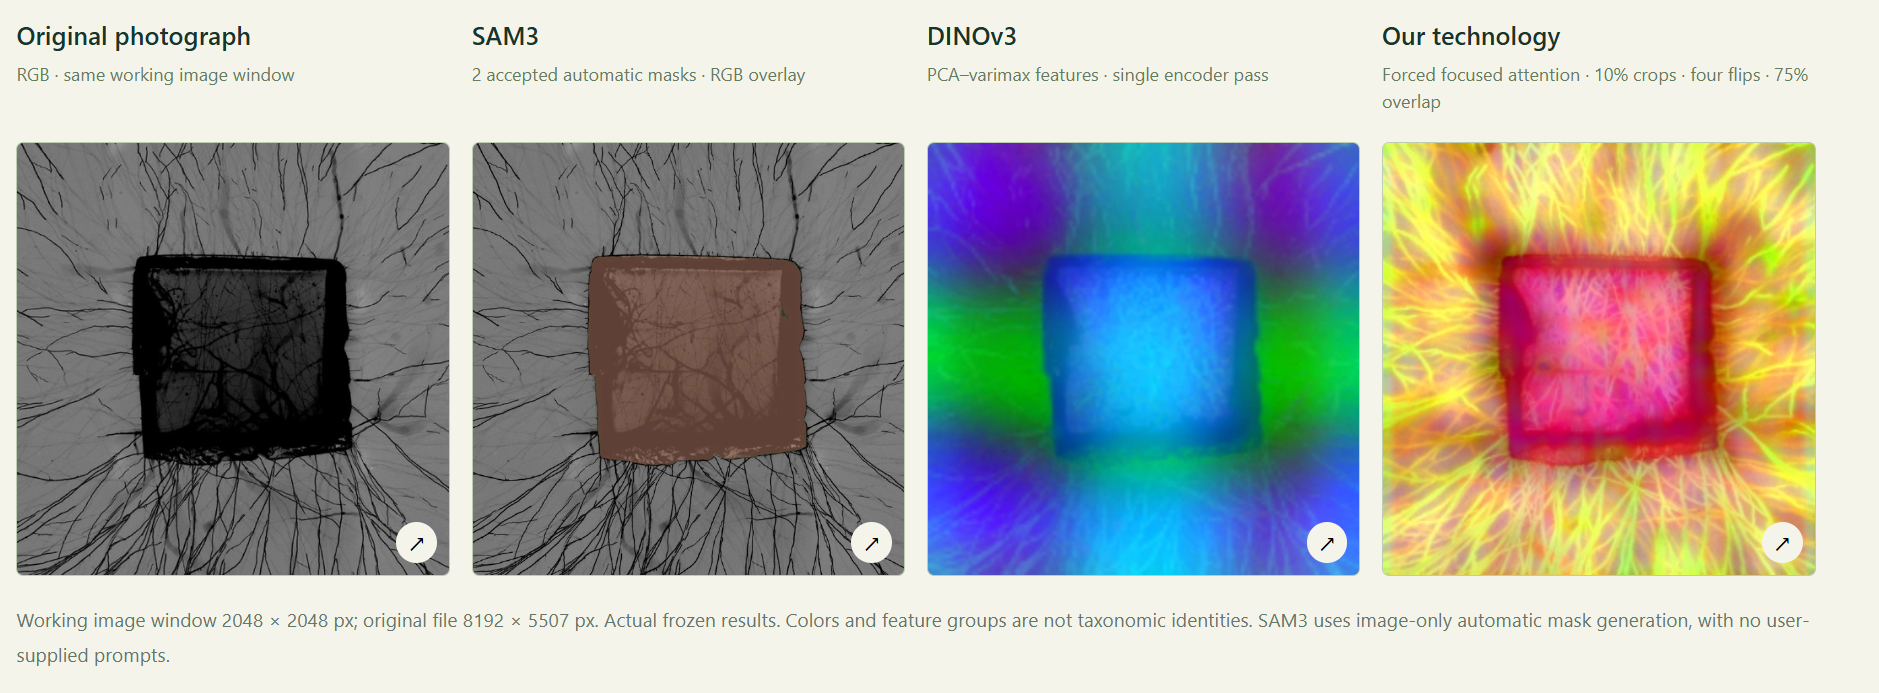
Select an image to open the full-size comparison.
Scroll across each image to inspect all four panels.
Monitoring, education, and reporting—connecting images, sound, and knowledge across ecological levels. The vision extends from individual organisms to whole ecosystems.
Species identification, traits, and organism descriptions.
Abundance, density, and observations through time.
Diversity, interactions, and community structure.
Habitat properties, ecological processes, and knowledge.
KICS-Zert develops AI- and citizen science-supported monitoring for certified biodiversity conservation projects. The goal is to make biodiversity assessments more scalable and connect observations with the needs of conservation, land management, and certification.
Led by Prof. Dr. Masahiro Ryo at the Leibniz Centre for Agricultural Landscape Research (ZALF), the project works with the Global Nature Fund and the wider biodiversity community. Smartphone observations and accessible AI tools are part of the path toward broader participation.
Agricultural biodiversity monitoring is the project focus. The reef, fungal, aerial, and microscopy examples extend the demonstrator’s research exploration across image domains.